Time and time again, I have been consulting with a bakery on their product issues, and this issue would surface. What is it? Would you take a stab at it?
It’s the oven. Most of the time, ovens are set to time, temperature and color. Some bakeries measure the exit temperatures, but some don’t.
“Why is the oven so important? Isn’t the internal crumb and texture developed at mixing?”
Don’t the other processes of fermentation and proofing affect the final product? Theoretically, yes. Practically, no. I have solved many product issues by just looking at the oven profile and manipulating oven zones.
“Why the oven?
“I believe many bakers do not understand the importance of this piece of equipment. It’s not only the final kill step, it’s also the only step in the entire process that physically transforms a viscous impermeable dough into a rigid porous bread. To me, it’s the most important step in the baking process because it is irreversible. I have to admit, there hasn’t been enough science that researches this particular transformation, though there is enough evidence to warrant that more attention be given to manipulating oven zones for product quality.
“How can an oven profile change my product quality?”
In order to show you the effect of different oven profiles on product quality, we used a straight dough method on a white bread formula with 60% absorption. Each loaf was 500g, and was proofed to a 3 cm height (above pan). Thermocouples were inserted midway into the top of the loaf and the bread was baked in a rotating convection oven at 218oC (425oF).

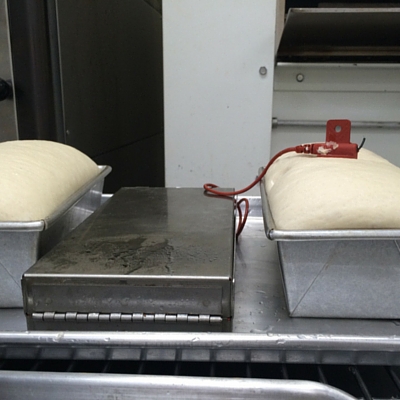
Picture 1. Datalogger in protective enclosure with multi-depth Breadometer sensor inserted into top of loaf.
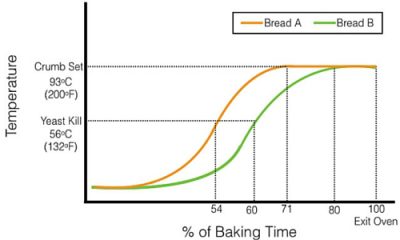
We baked Bread A to 30 minutes and Bread B to 24 minutes. Below are their thermal profile results.
Our results show that by cutting 6 mins of baking time off Bread B, we delayed the yeast kill (from 54% to 60%), and most importantly, the crumb set (from 71% to 80%), resulting in less bake out of the bread.
Typical crumb set values for white bread formulas are within the 80-90% range. Most white bread formulas, especially buns and rolls, require such an early crumb set (80-85%) for them to hold well together on a sandwich. However, larger loaves of bread need later crumb set at around 90-95% for a longer shelf life.
As you can see, our crumb set was very early for Bread A. At 71%, we ere far from the 90% crumb set recommendation. With most ovens that span several zones, this would require a drop in temperature in the middle-end zones with a cut in baking time. Since this is a rotational oven without any zones, we had to delay the crumb set through cutting the baking time by 6 minutes. This also showed a decrease in the area under the thermal profile, which indicated a large decrease in energy consumption by Bread B. When you over-bake bread, not only do you reduce its shelf life attributes, you also consume a lot more energy.
I would like to point out that this is not the ideal way to decrease crumb set in a commercial baking environment. The difference here is zone manipulation. All commercial or industrial ovens have zone temperature controls. If this profile exists in such ovens, the manipulation of the middle-end zones would be required to bring the crumb set closer to 90%.
“Why does this matter to me? I can measure the exit temperature and do my moisture tests.”
Firstly, using a thermometer is like taking a picture, one shot in time. It only provides the temperature of the product when it exits the oven. It doesn’t tell you how long it’s been in the crumb set zone, therefore you are not aware of the amount of bake out that the product experiences. Secondly, I have yet to see a correlation between moisture content and texture (or perceived moisture) in bread, and the following supports my experience. The texture analyzer and moisture analyzer were used to provide these results.
| Firmness | Resilience | Moisture | |
| Bread A day 1 | 553.9 | 0.29 | 41.0 |
| Bread B day 1 | 441.5 | 0.30 | 42.8 |
| Bread A day 8 | 980.8 | 0.15 | 41.6 |
| Bread B day 8 | 842.8 | 0.16 | 42.4 |
Table 2 : Texture and moisture results from fresh and stale bread
One would expect the moisture to drop a few percentage points due to the increase in firmness over 8 days of storage, but this was not so. In fact the moisture in the loaves did not change significantly over time, while the firmness of the bread increased drastically. Therefore, I believe texture is determined by the crumb set, and not the moisture of the bread. When you delay the crumb set of bread, you soften your product. When crumb set is unusually early, do expect customer complaints of dry and crumbly bread (even though moisture is in the acceptable range of 35-40%). This pertinent oven information cannot be obtained without a thermal profile.
“How do I apply this information? I can’t run thermal profiles and texture all day.”
What I suggest to bakers is to implement these procedures on new product lines. Instrument the beginning of a first commercialization run with a thermal profiler, and set the baking parameters for the new product that way. Then fine-tune your crumb set range through a set of shelf life studies with the texture analyzer. Once you set this right, you should periodically run thermal profiles to ensure machine, ingredients and process stability, and run texture studies when obvious processing issues or other complaints arise.
BAKERpedia is offering a science seminar: The Science of Commercial Bread Baking. An intensive one-day seminar, we will cover these techniques and answer any questions that you may have. We have limited seating for this seminar, so please register now. If you can’t make it, visit our tech help page for a one-on-one consultation for this topic.


